Condo vs single-family into early ski season — property-type absorption slices
Opening weekend is close enough to color showings, and the shortlist is already two stacks: condominium vs single-family. Early-November calendar-window absorption — who’s still negotiating before lifts, who’s sticky by Ar code — is a different read. Here the question is narrower: which type column are you competing in, how thin is that sample, and which PCBOR area codes sit under the number?
This is property-type absorption literacy into early ski season. It’s not a carrying-cost compare (dues vs heat, snow, and roof), and it’s not a nightly-license geography map. Keep those essays on their own dates. Stay on labeled condo vs SFH columns — not a blended “Park City” absorption sentence.
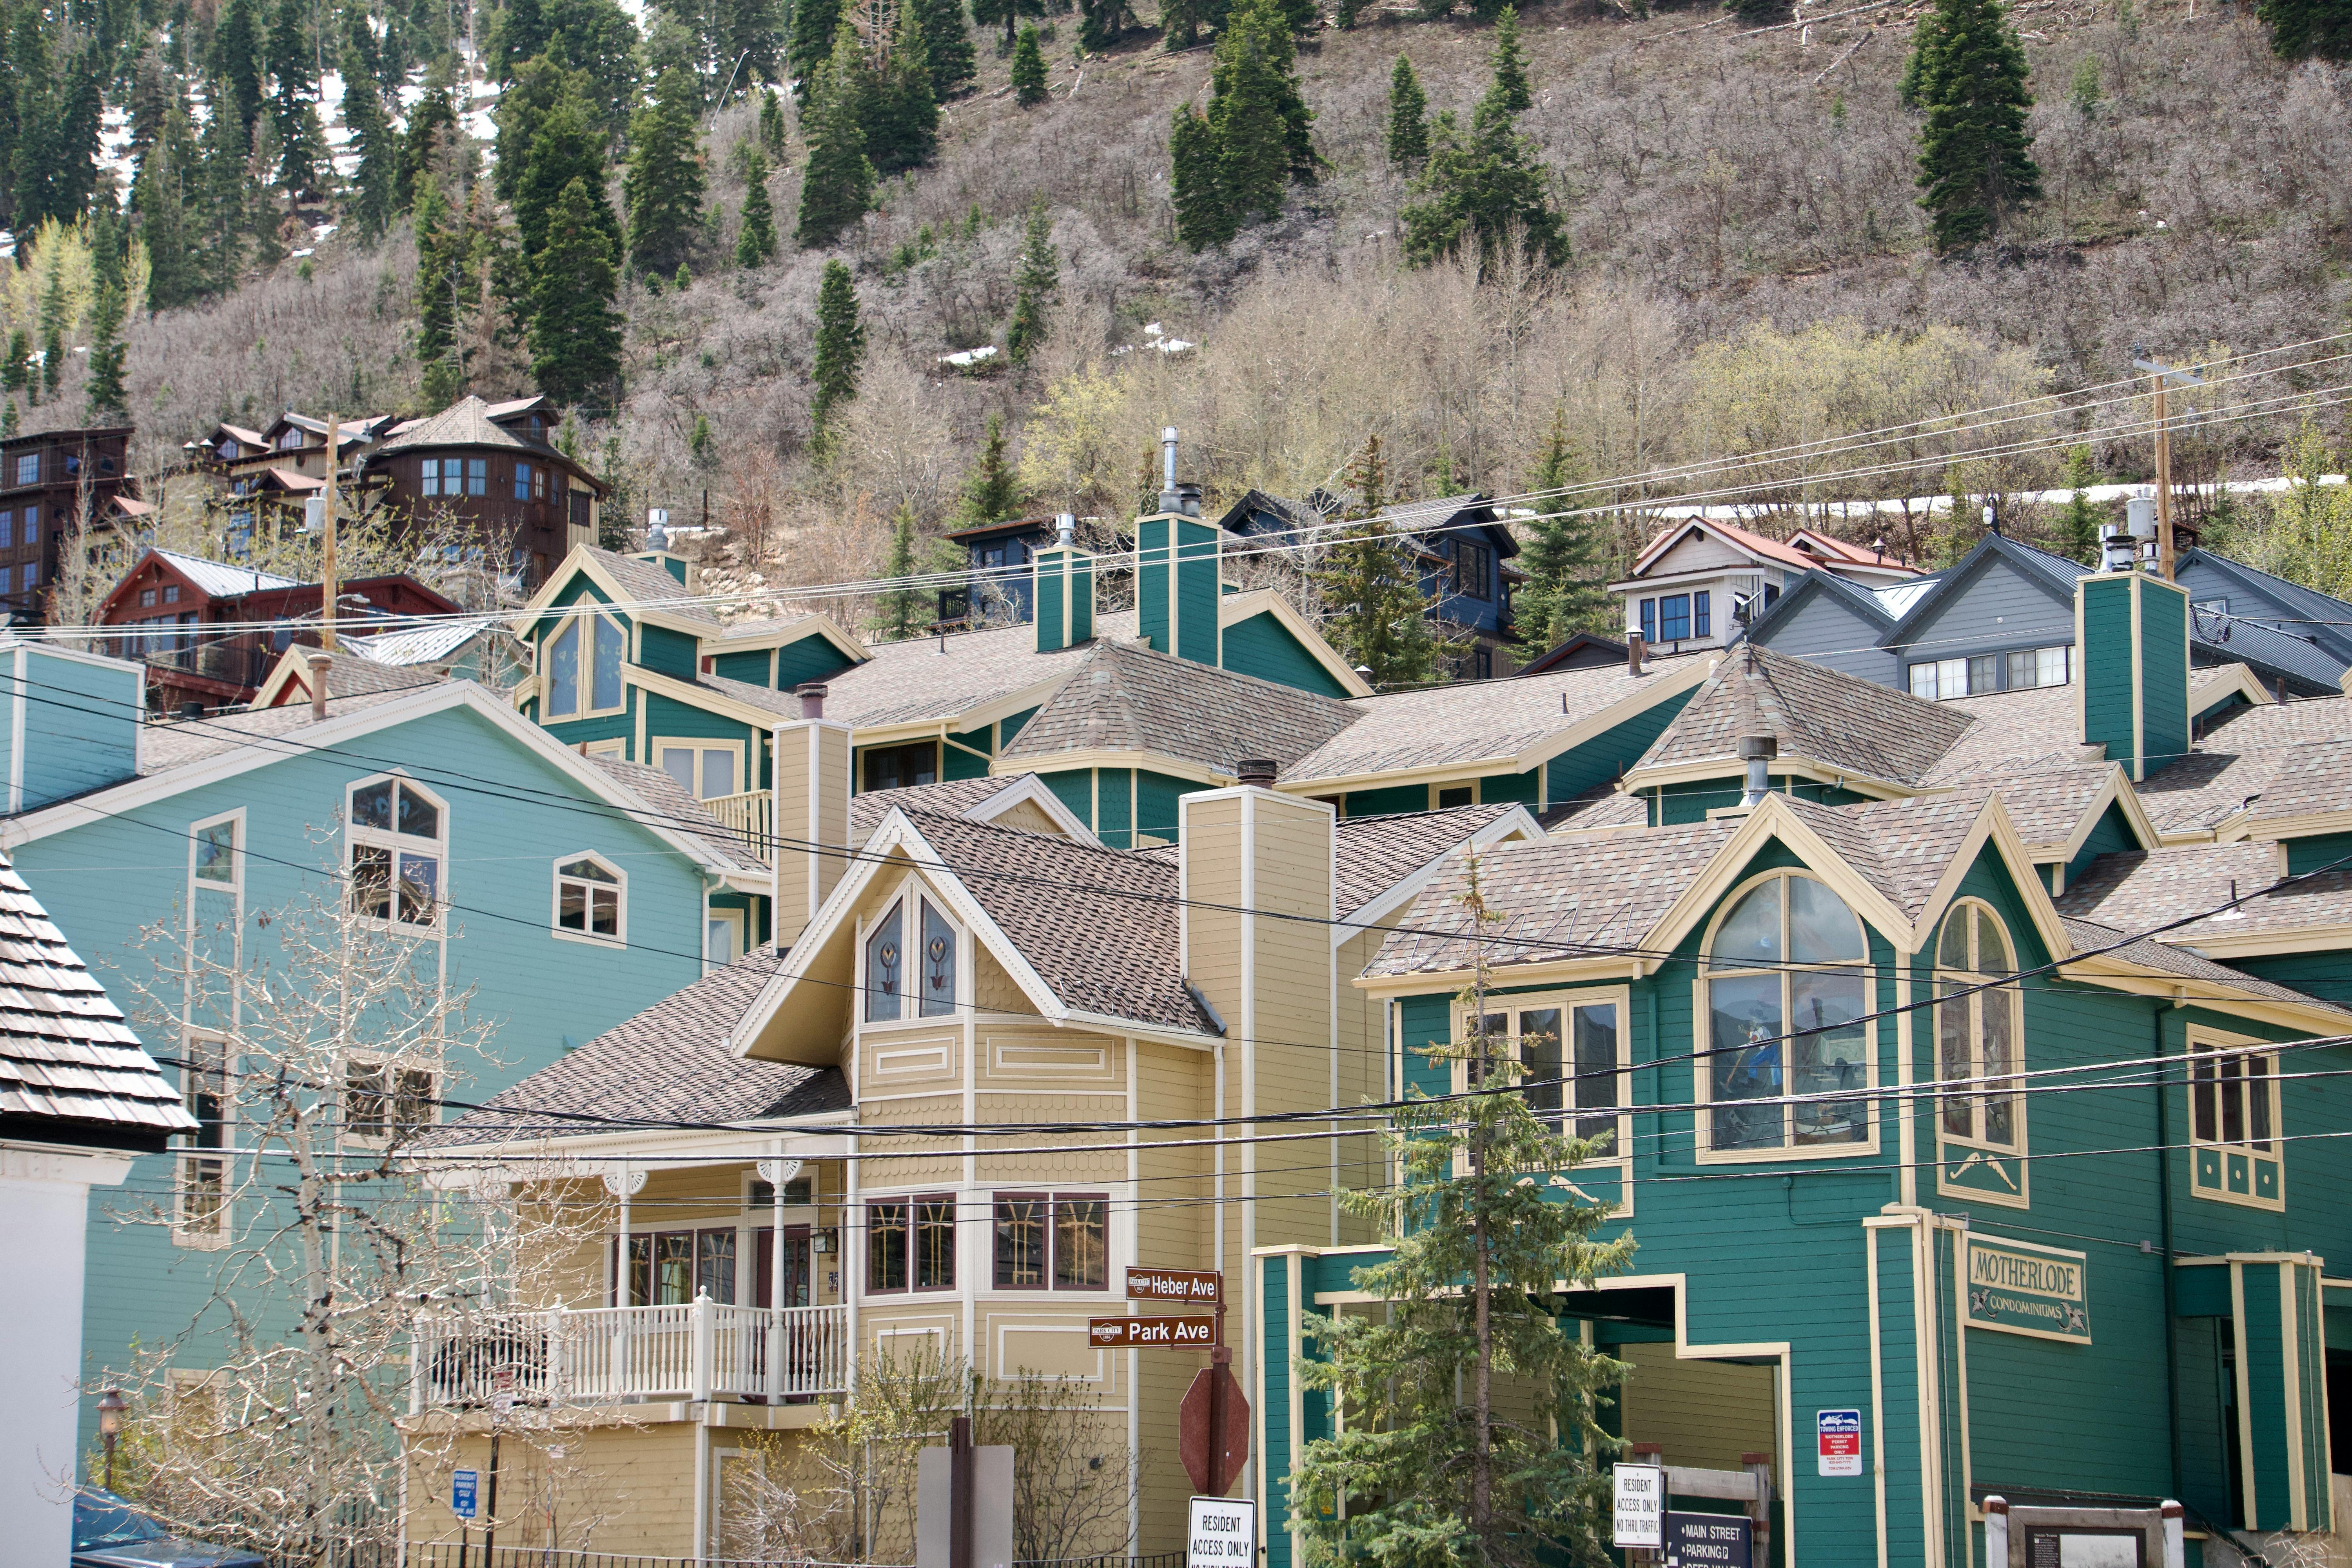
Single-family streetscape mood — start with the SFH column for your Ar codes, not a blended median. Photo: Pexels / Pexels License.
Label type, geography, and time window every time
Print the map with the numbers — and name the property-type column first. Park City Limits Areas 1–9, Snyderville Basin 10–23, Jordanelle 24–29, Heber Valley 30–47, Kamas Valley 50–53, and Primary Market = Summit + Wasatch. A Primary Market condo median is not “Park City.” A Summit County sheet is not Areas 1–9. The PCBOR quarterly hub is where those labels stay honest.
Park City Mountain’s target opening is Friday, Nov. 20; Thanksgiving is Thursday, Nov. 26. Those dates color demand narrative — they aren’t a published November condo-vs-SFH absorption rate, and they don’t tell you which type column to open.
What Q2 2026 showed by property type
As of mid-to-late October, the newest full PCBOR quarter was Q2 2026 (period ending June 30). Read the type columns before you average them. MLS-wide, single-family recorded 319 sales and about $840.9M (+6% units / +2% volume vs Q2 2025). Condominiums recorded 203 sales and about $335.4M (−2% units / −2% volume). Board narrative around condos pointed to stabilization after an earlier pullback and post–new-construction digestion — not a slogan that “condos don’t sell in ski season.”
Land ran as a separate shelf — on the order of 147 sales / about $181.3M in that quarter’s land framing. Don’t blend land into a condo-vs-SFH absorption sentence.
Rolling twelve months to June 30, 2026, told a longer type-column story: SFH about 1,341 sales / $3.609B (+8% / +15%); condos about 847 sales / $1.468B (−14% / −7%). Rolling declines on condo units are context for supply digestion across a year — not a forecast for how your Area 10 condo stack behaves the week lifts open, and not a substitute for a live filter on the column you’re actually in.
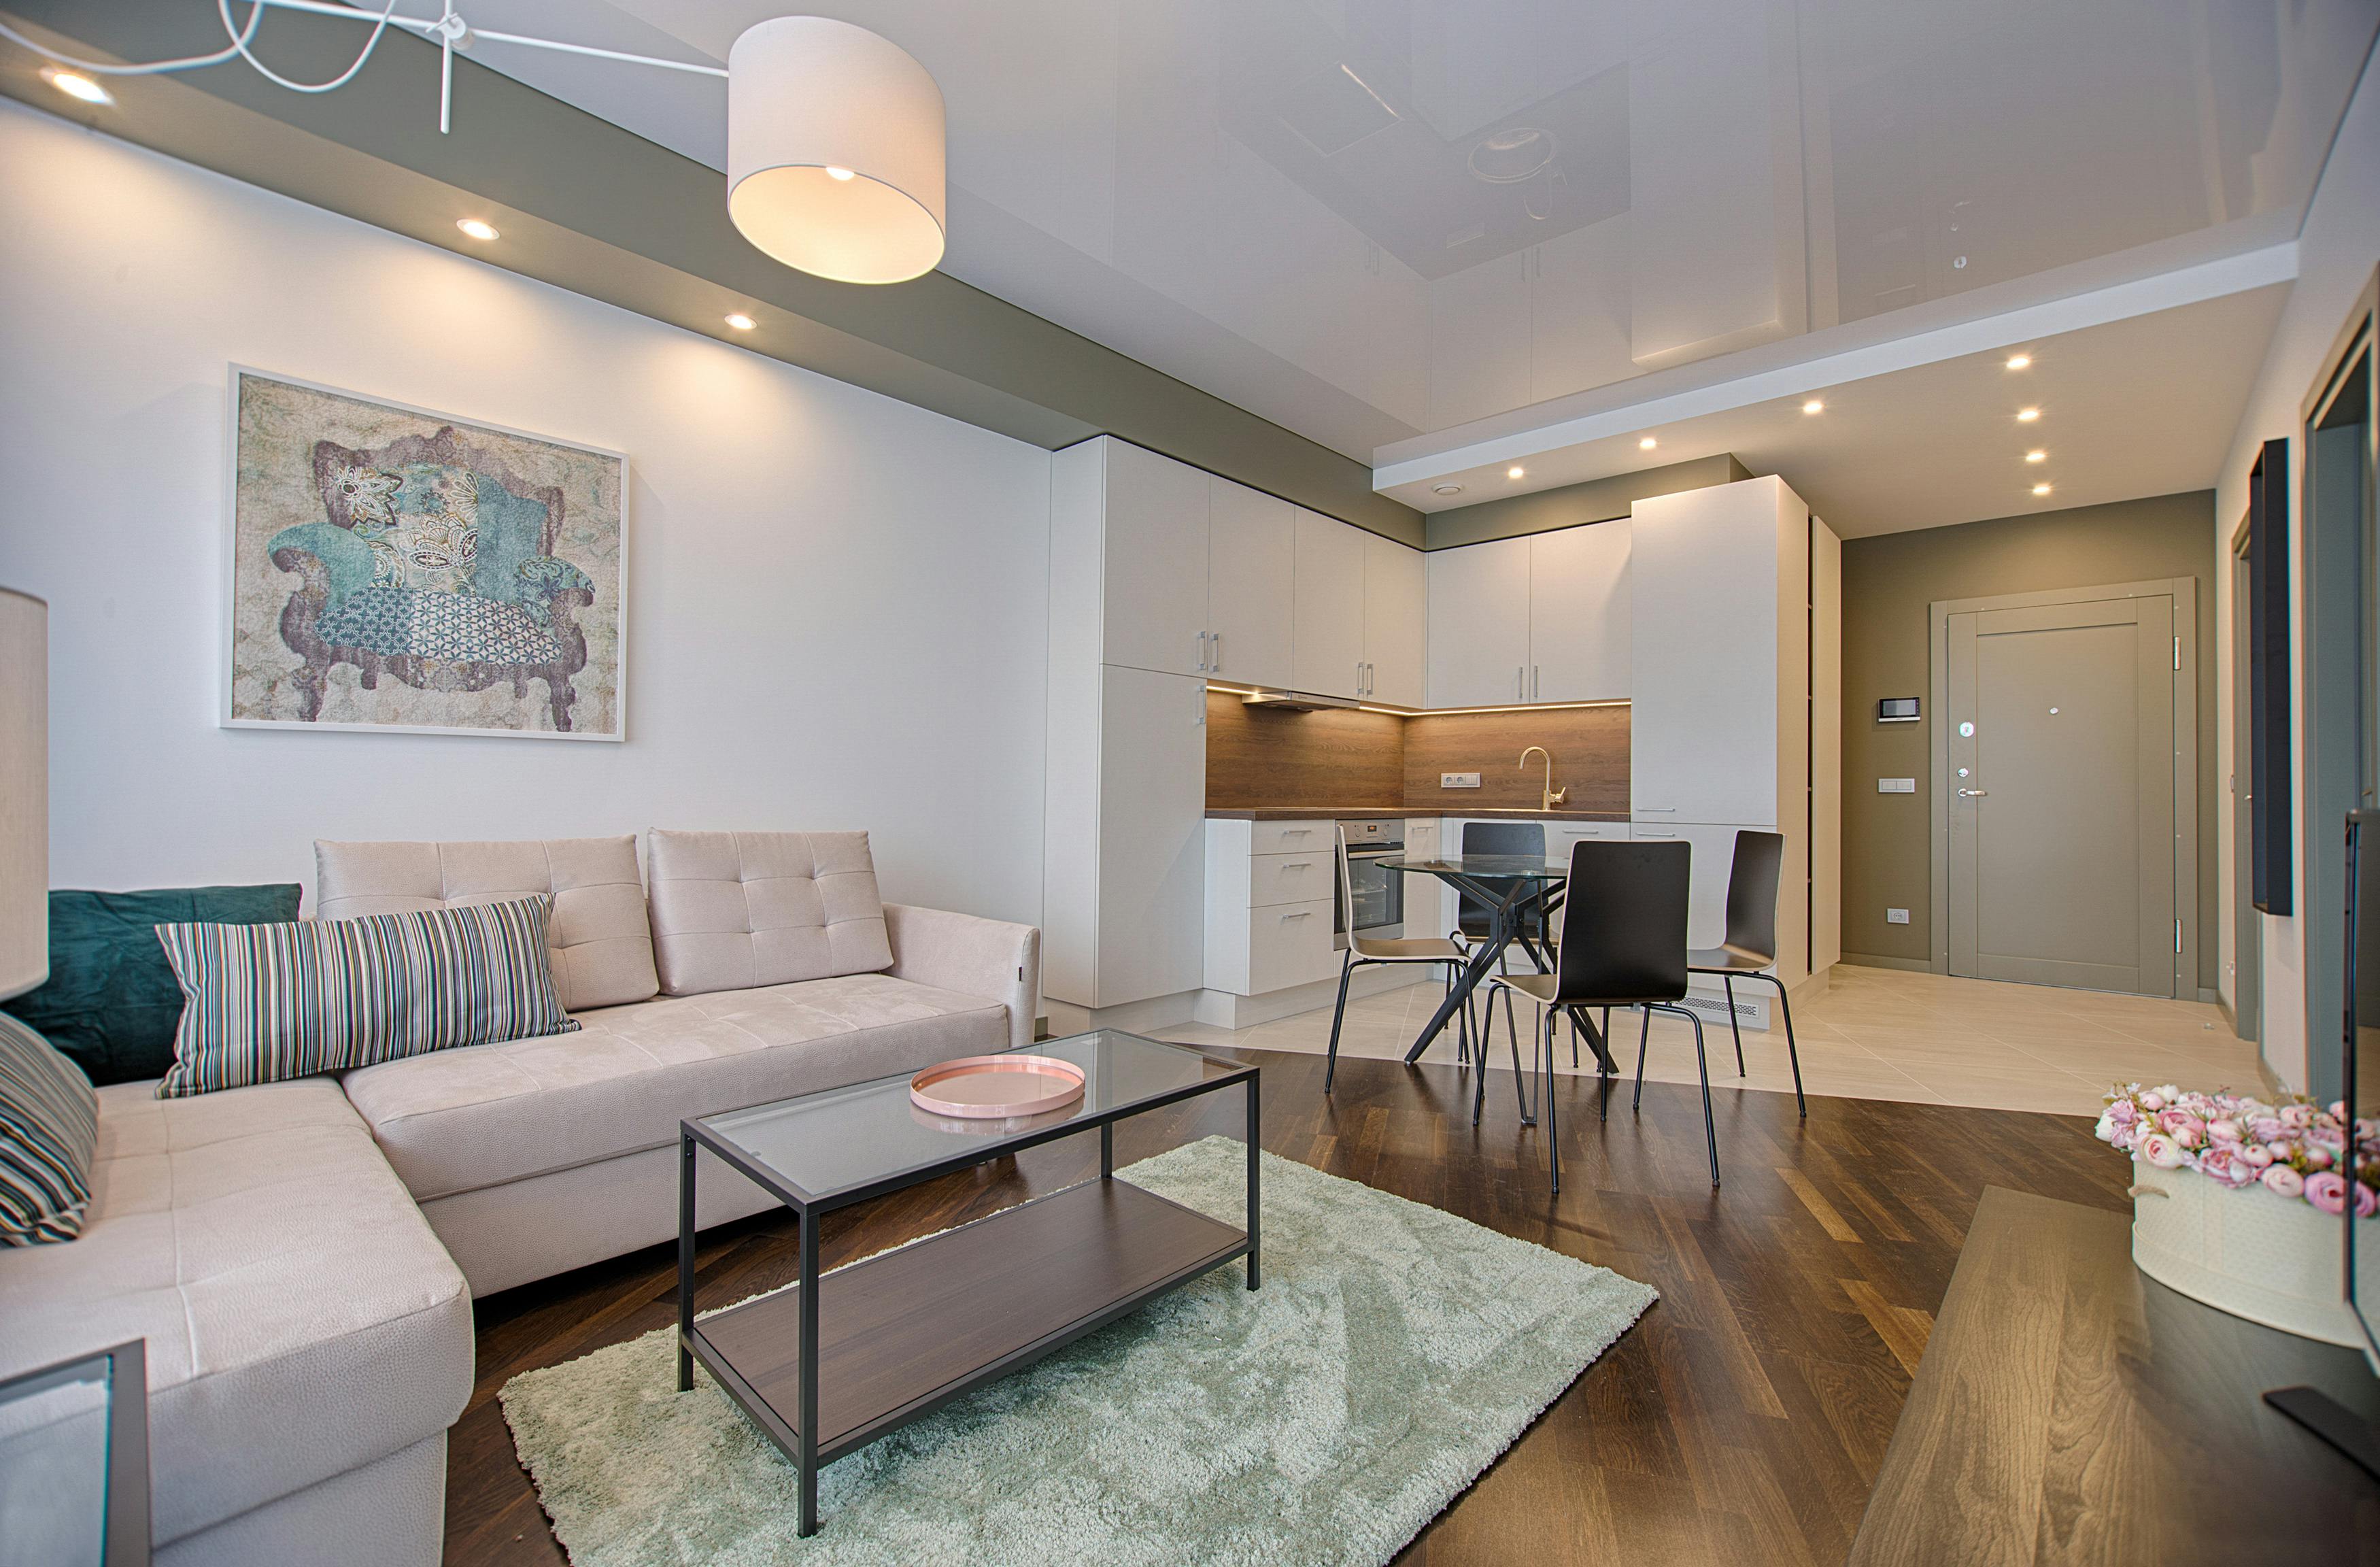
Condo lock-and-leave mood — open the condo column for your Ar band; SFH comps in the same corridor are a different table. Photo: Pexels / Pexels License.
Same quarter, different geographies
Primary Market (Summit + Wasatch) Q2 2026 medians sat near $1.685M for SFH (259 sales) and $1.167M for condos (189 sales). Zoom into labeled bands and the type columns diverge further — watch the sample sizes as closely as the dollars:
- Park City Areas 1–9: SFH median around $3.8M (29 sales) vs condo around $2.325M (47)
- Basin Areas 10–23: nearer $2.25M SFH (77) vs $1.13M condo (58)
- Jordanelle Areas 24–29: around $3.669M SFH (24) vs $1.239M condo (64)
Thin samples move. A 24-sale SFH cell is not the same table as a 77-sale Basin SFH cell — even in the same quarter. Refresh the board row (or a live MLS pull with the same type + Ar filters) before you price.
For winter-season historical framing, PCBOR’s Q4 2025 / calendar 2025 notes still help: average monthly residential inventory about +14% YoY, overall absorption near 5.2 months, combined SFH + condo volume around $5.75B. Label the year. Don’t treat that blended absorption line as a November 2026 condo-vs-SFH split.
County sheets don’t give you a clean condo split
The UAR Summit County August 2026 Local Market Update showed inventory around 831, months supply near 4.6, days on market until sale around 75, and percent of original list price received near 93.5% on the summary view. Useful county pace — and still a combined property-type sheet. It will not hand you a clean condo months-supply column next to an SFH column. Re-open the live LMU if you need the current as-of date; don’t average it into PCBOR Ar × type tables.
Third-party DOM commentary sometimes quotes very different single-family vs condo/townhome medians. Different datasets don’t merge. Prefer PCBOR-labeled type columns for the decision in front of you, or a live MLS pull with filters you can defend.

Snowy residential townscape — early-ski demand can lift traffic; it still doesn’t merge condo and SFH into one absorption number. Photo: Alex Moliski / Unsplash.
How I’d choose the table you’re competing in
Here’s the practical spine. If you’re buying a lock-and-leave condo near a base, open the condo column for your Ar codes — sample size included — not a blended “Park City median.” If you’re selling a basin single-family, open the SFH column and recent list-to-sale behavior in that same type filter. Early ski season can change showing traffic; it doesn’t erase the need for labeled comps, and it doesn’t turn two property types into one table.
Private clubs near either property type stay out of the absorption sentence — clubs are not ski resorts. Calendar-window reads on sitting listings and price flexibility before Nov. 20 live on their own date; this post stays on which type column you should be pricing against.
Figures above reflect PCBOR Q2 2026 and labeled 2025 year-end framing, plus the UAR Summit August 2026 LMU as of those releases. November monthly condo-vs-SFH absorption wasn’t published yet. Pricing and inventory move weekly — we’ll pull a live condo-vs-SFH read for your area codes before you price or offer.
If you want that live property-type pull for a specific shortlist or listing, I’m glad to sit down with the Ar codes, the type filter, and the newest board release we can open.
Talk with Esteban J. Nunez — Park City Realtor.
Categories
Recent Posts