How to Read Winter Medians Without Blending Park City Geographies
Someone forwards you a headline with one “Park City median.” Coffee’s still warm. You’re weighing a winter buy, a list price, or a second-home refinance — and the number looks clean until you ask the only question that matters: which bag of sales is this?
Mid-to-late October is when last winter’s board releases and late-summer county sheets start circulating in group chats. Before Thanksgiving decision windows firm up, here’s a kitchen-table checklist for reading PCBOR and UAR winter medians without blending Park City city limits, the Primary Market, Summit County, and a rolling twelve-month cut into one mythical figure.

Park City rooftops under snow — winter-market mood in the Wasatch Back, not a priced listing. Photo: Alex Moliski / Unsplash.
Name the source before you trust the median
Two datasets people paste next to each other — and they are not the same map.
Park City Board of REALTORS® (PCBOR) / Park City MLS quarterly reports cover Greater Park City / Wasatch Back MLS geography. In board tables, the Primary Market means Summit and Wasatch Counties framed the PCBOR way. Sub-areas carry area codes: Park City (Areas 1–9), Snyderville Basin (10–23), Jordanelle (24–29), Heber Valley (30–47), Kamas Valley (50–53). The board itself flags a highly segmented market — only areas meeting minimum transaction thresholds appear, and data are preliminary and subject to revision. Start at the PCBOR quarterly statistics hub.
Utah Association of REALTORS® (UAR) Local Market Updates are county geographies — Summit County vs Wasatch County — not PCBOR area codes. ShowingTime Plus LMU sheets carry their own as-of dates; a single month can look extreme because the sample is small. Those pages are useful for county pace. They are not a substitute for Areas 1–9.
Statewide Utah charts that sometimes appear on the same LMU pages belong in a third mental tab. A statewide median next to Old Town without a label is how geographies get blended.

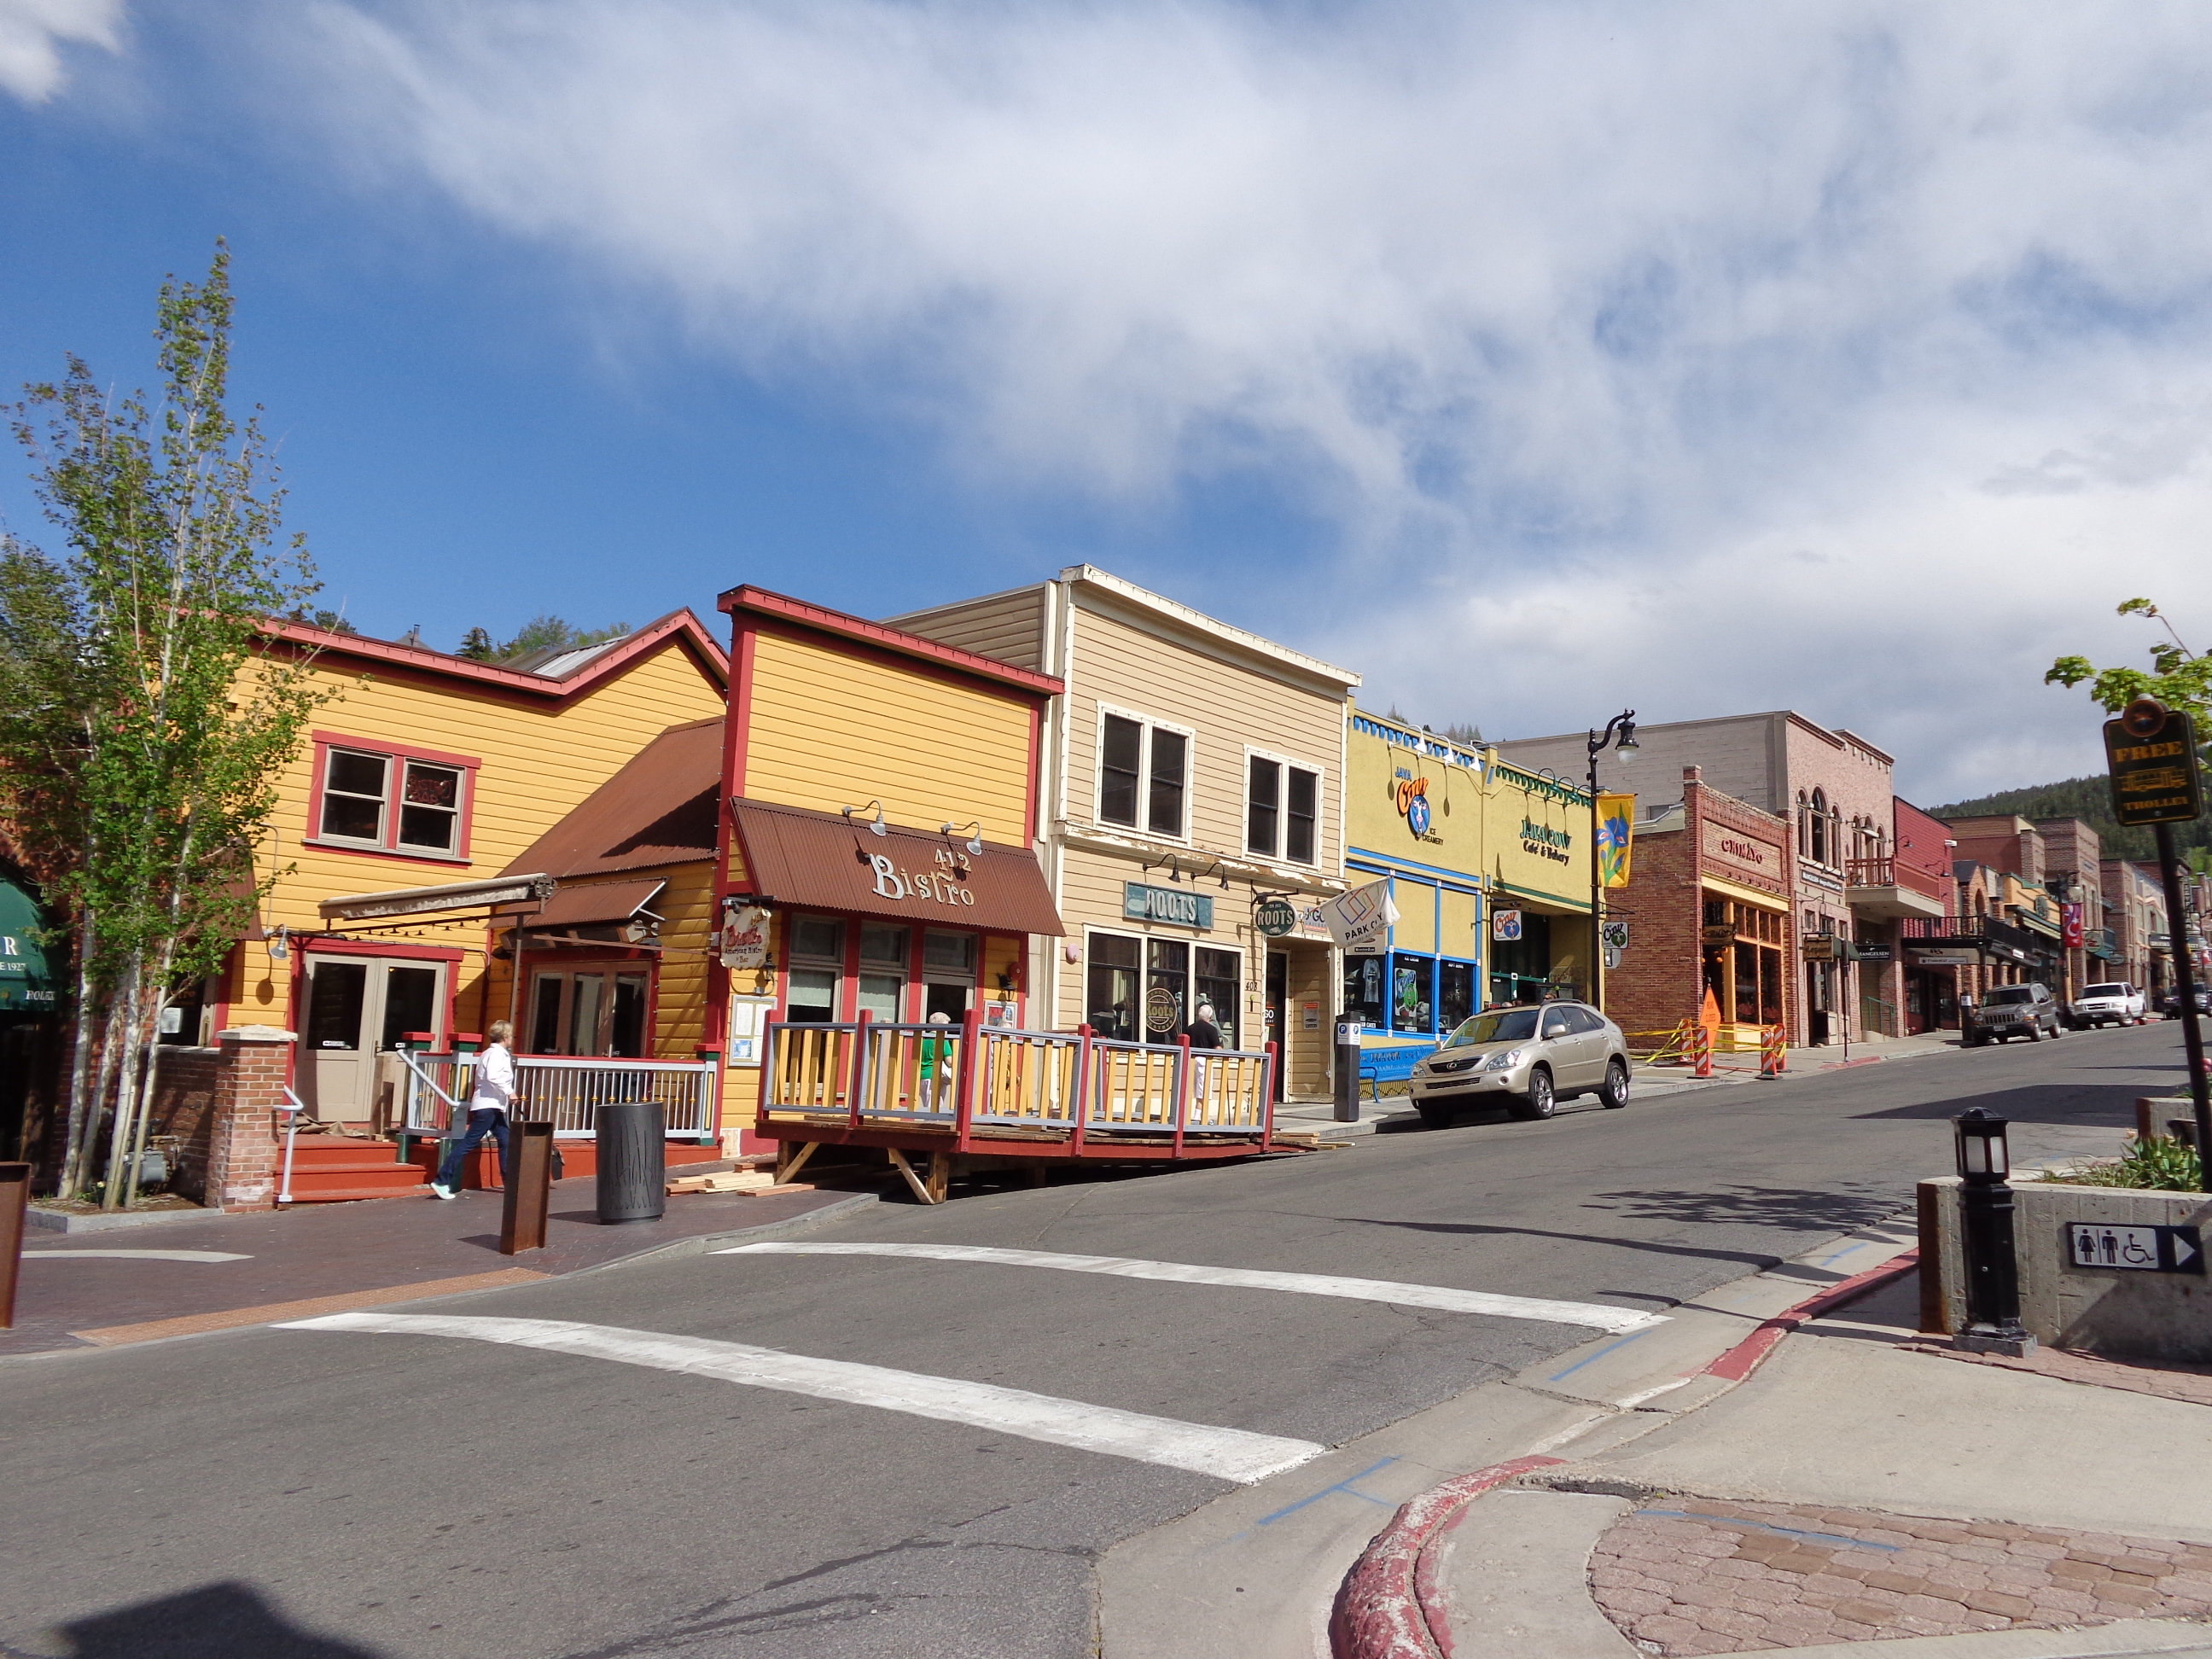
Historic Main Street, Park City — place context for city-limits geography (Areas 1–9), not a listing address. Photo: Saalebaer, Wikimedia Commons, CC BY-SA 3.0.

Label the winter window — Q4, Q1, month, or rolling 12
Same source can still mislead if the calendar slice is wrong. Print the window in the same breath as the geography.
Q4 / holiday context (calendar 2025 year wrap from PCBOR): Combined single-family and condo sales volume about $5.75 billion for 2025 — second-highest in that board framing, also cited in local coverage. Single-family volume about $3.52 billion (+26% year over year) on roughly 6% more units — volume moved more than unit count. Condo volume about $1.66 billion (+20%) despite about 8% fewer units. For Park City proper (Areas 1–9) single-family in calendar 2025: 143 sales (+29%), volume about $712 million (+39%), median $3,825,000. That full-year city-limits median is not the same sentence as a Q4-only row. Source: PCBOR 2025 4th Quarter statistics — re-open that board page nearer publish if you’re quoting these year-wrap rows and figures have revised.
Board narrative also notes December 2025 single-family median down about 1.6% versus December 2024; Q4 pended/closed about −2%; December pended/closed about −14%; absorption for 2025 around 5.2 months; average monthly residential inventory +14% year over year. Soft December activity is a calendar label — not a blended “winter crash” across every area code.
Q1 / ski-season quarter (ending March 31, 2026): MLS-wide, 529 transactions / about $1.195 billion versus Q1 2025’s 562 / about $1.321 billion (−6% units / −10% volume). Single-family units +14% / volume +9%; condos −31% / −41% in that quarter’s split. Source: PCBOR 2026 1st Quarter statistics.
Rolling 12 months ending March 31, 2026 (same Q1 release): single-family median about $1.775 million MLS-wide (+20%); about $1.975 million Primary Market (+18%). Condos: 850 sales (−16%); average price about $1.73 million (+11%). Total market about $5.636 billion (+9%). A rolling twelve-month median smooths holiday softness and ski-season spikes — useful, and still not Areas 1–9 alone.
For the latest full PCBOR quarter on the hub as of mid-September, Q2 2026 (period ending June 30, 2026) sits on the hub: total all types about $1.358 billion (+7% year over year) on 669 transactions (+10%). That is a spring cut — cite it as latest available board freshness, not as “winter.”

Deer Valley winter terrain — ski-season market context for Q1 windows, not a priced neighborhood pitch. Photo: Don Ramey Logan, Wikimedia Commons, CC BY 4.0.

Side-by-side: three labeled bags of sales
Here is the teaching juxtaposition — same region, different bags. Do not average them.
Q1 2026 single-family medians (PCBOR Primary Market table):
- Park City Areas 1–9: 26 sales, median $4,016,000
- Snyderville Basin 10–23: 78 sales, median $2,869,000
- Jordanelle 24–29: 30 sales, median $4,204,000
- Heber Valley 30–47: 59 sales, median $1,292,000
- Kamas Valley 50–53: 23 sales, median $735,000
- Primary Market total single-family: 225 sales, median $2,200,000
Condo medians in that same Q1 table tell a parallel story: Park City Areas 1–9 median $2,400,000 (40 sales); Basin $925,000 (49); Jordanelle $1,570,000 (38); Heber $475,000 (9); Primary Market condo median $1,250,000 (139 sales). Board narrative ties part of the condo slowdown in city limits to supply mix after a large new-product wave — mix and sample size move medians even when “the market” feels familiar.
UAR Summit County — August 2026 (LMU current as of September 10, 2026): closed sales 193 (−21.5% year over year); median sales price $1,525,000 — about 7% lower than August 2025’s $1,636,400 on those dollar figures; inventory 831; months supply 4.6; days on market 75. Year-to-date through August 2026 median $1,743,000 (+2.1% vs YTD 2025). Source: UAR Summit County Local Market Update.
UAR Wasatch County — August 2026 (same as-of): closed 138 (−21.1%); median $1,120,000 (−2.7% vs August 2025’s $1,150,000); inventory 698; months supply 4.8. YTD median $1,100,000 (flat year over year in that table). Source: UAR Wasatch County Local Market Update. County LMU sheets update on their own as-of dates — reconfirm Summit and Wasatch nearer publish before you lean on the August row.
Read those three breaths together: Summit County UAR August median (~$1.53 million) ≠ Park City Areas 1–9 Q1 single-family median (~$4.0 million) ≠ Primary Market Q1 single-family median (~$2.2 million). Always print source + geography + window in one sentence.

Park City aerial in winter — a reminder that one skyline holds many MLS area codes and county lines. Photo: Everwest, Wikimedia Commons, CC BY 4.0.

Your five-point median checklist
When the next chart hits your phone, run this before you draw a conclusion:
- Source — PCBOR quarterly table, or UAR county LMU?
- Geography — Areas 1–9, Primary Market (Summit + Wasatch in board framing), a named basin/valley band, Summit County, Wasatch County, or statewide?
- Property type — single-family or condo (they diverge inside the same area codes)?
- Window — Q4 holiday quarter, Q1 ski quarter, a single month, calendar year, or rolling 12 months?
- Unit count / mix — how many sales, and did new construction or a thin sample move the median?
PCBOR’s own year-end narrative is blunt on segmentation: property age, amenities, ski access, price tier, and single-family versus condo diverge. In Areas 1–9 calendar-year framing in the Q4 notes, condo medians and single-family medians can move in different directions in the same geography — another reason one “Park City” number without labels is usually the wrong sentence.
Tiny samples get board warnings too (Empire Pass and similar micro-cuts). If the release prints one sale, treat that median as a footnote, not a market law.
Read your slice with the windows labeled
You do not need a blended Wasatch Back average to make a winter decision. You need the latest PCBOR cut for your area codes and property type, plus the matching time window — and, if someone quotes a county sheet, the honesty to keep UAR Summit or Wasatch in its own column.
If you’re weighing a winter buy or sell and want to sit with the board tables for your micro-market — Areas 1–9, Basin, Jordanelle, Heber, or Kamas — we can open the newest PCBOR quarterly statistics together and keep every median labeled. You decide what the number means for your file.
Talk with Esteban J. Nunez — Park City Realtor.
Categories
Recent Posts