October shoulder inventory: reading the shelf between foliage and opening
Foliage weekends are mostly in the rearview. Park City Mountain’s target opening is still a few weeks out — Friday, November 20, 2026, conditions permitting — and City plow season starts November 1. That gap is the October shoulder: calm enough to tour, early enough that ski-weekend noise hasn’t fully arrived.
If you’re shopping now, the kitchen-table question isn’t “is inventory low?” It’s this: which geography and which time window is that listing count actually describing? Park City Limits, Snyderville Basin, Jordanelle, Heber Valley, Kamas Valley, Primary Market, and a county UAR sheet are different shelves. Label the slice before you decide the market feels “tight” or “soft.”

Autumn near Deer Valley — the foliage-end shoulder when buyers still tour calmly. Photo: Tony Webster, Wikimedia Commons, CC BY 2.0.

Name the PCBOR slice before you read the count
On the Greater Park City / Wasatch Back MLS, area codes matter every time:
- Park City Limits — Ar 1–9
- Snyderville Basin — Ar 10–23
- Jordanelle — Ar 24–29
- Heber Valley — Ar 30–47
- Kamas Valley — Ar 50–53
- Primary Market in board tables = Summit + Wasatch Counties
The board’s own caveat is worth keeping in mind: the market is highly segmented; only areas meeting minimum transaction thresholds appear; figures are preliminary and subject to revision. Start at the PCBOR quarterly statistics hub, then match the area codes on the listing you’re actually considering.

Main Street, Park City — place context for city-limits geography (Areas 1–9), not a listing address. Photo: Saalebaer, Wikimedia Commons, CC BY-SA 3.0.

What the latest labeled boards still show
The latest full PCBOR quarter on the hub remains 2026 2nd Quarter (period ending June 30, 2026) — Q3 2026 had not posted when we re-checked. That is not “October inventory,” and you shouldn’t treat it as such — but it is still the newest board-wide composition snapshot for the Primary Market shelf. Open the hub again the week you decide; if 3rd Quarter is up, read that cut as the latest board shelf and treat the Q2 figures below as the prior slice. Leave a live October active count to a fresh MLS pull with the area filter printed — not a guessed board total.
In that Q2 cut, the board reported 669 transactions and $1.358B in volume across all types (+10% units / +7% volume year over year). Rolling twelve months to June 30 ran $5.728B on 2,695 transactions. Land stood out as its own shelf: Primary Market land sales hit 144 / $180.5M (+58% units / +102% volume) — useful if you’re comparing finished housing inventory to the vacant-lot pipeline, and a different story from the resale condo and single-family shelf.
Single-family Q2 unit counts by geography — the shelf map for what’s clearing, not an October price pitch: Park City Ar 1–9 29 sales; Basin 77; Jordanelle 24; Heber 97; Kamas 22; Primary Market SFH 259. Condo Q2 units: Park City Ar 1–9 47; Basin 58; Jordanelle 64; Primary Market condo 189. Labeled medians sit on those same board rows if you need them later; how to read winter median tables without blending geographies is a different literacy map. Today’s job is which shelf the shoulder count is describing.
Calendar 2025 / Q4 board narrative is useful only as labeled history: average monthly residential inventory ran about +14% year over year, with overall absorption framed near 5.2 months in board language, and active-listing levels described as the highest average since the 2020 anomaly. Q1 2026 coverage continued an inventory-recovery theme and noted post-2022 active-listing bands that often sat below the pre-COVID ~1,100–1,200 range. Use those as seasonal context — not as a live October count.

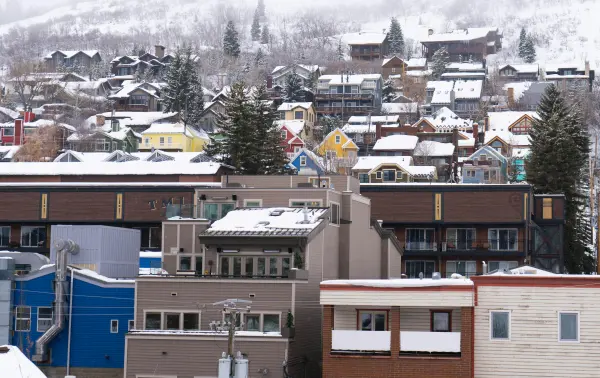
Park City rooftops under snow — shoulder-to-winter inventory mood, not a priced listing. Photo: Alex Moliski / Unsplash.
County sheets and third-party counts are different datasets
Utah Association of Realtors Local Market Updates are county geography — not PCBOR Ar 1–9. The Summit County August 2026 LMU (current as of September 10, 2026 on the sheet when we re-checked) showed new listings 173, pending 201, closed 193, inventory of homes for sale 831, and months supply 4.6, with days on market until sale 75. Pull the live UAR Summit County LMU again nearer publish before you lean on any YoY price direction — monthly columns are easy to misread, small samples swing, and the as-of date can roll.
Wasatch County has its own companion sheet. Keep it separate. National aggregator snapshots (for example realtor.com county pages) and some local ShowingTime / InfoSparks commentaries will print different active-listing and months-supply figures because filters differ — new construction, deed-restricted inventory, and MLS scope can move the math. A Summit County months-supply near 4.6 on a UAR sheet and a figure near 8.6 in another local series are not errors to average; they are different lenses. Pick one labeled source for the decision you’re making, then stick with it.
How to use this window before Nov. 20
Park City Mountain’s Nov. 20 target opening can slip — the prior season’s target moved when early snow lagged — so treat opening as a planning marker, not a guarantee. Municipal snow ops still flip to high tempo on November 1. Thanksgiving week (Thursday the 26th / Friday the 27th) ends the calm shoulder for many showing calendars — a buyer window note, not a list-live timing map.
Practically, if you’re a quiet buyer in late October:
- Write down the PCBOR area codes for every address on your shortlist.
- Ask whether the inventory story you’re hearing is a monthly UAR county sheet, a quarterly PCBOR press, or a rolling twelve-month board figure.
- Separate land activity from finished housing — Q2’s land surge is real board data, and it is not the same shelf as condos and single-family homes.
- If someone quotes a live MLS active count at publish time, demand the pull date and area filter.
October’s monthly board inventory isn’t something to guess from an older quarter. Re-open the PCBOR hub and the county sheet the week you decide — then read only the geography you actually care about.
If you want a micro-market inventory read for the area codes on your shortlist — labeled against the latest board and county sheets, before ski traffic thickens — I’m glad to pull that with you.
Talk with Esteban J. Nunez — Park City Realtor.
Categories
Recent Posts