Park City Limits: 4 days. Summit County: 9.1 months. Same August.
Greater Park City Q2 2026 sales topped $1.35 billion, and the product that moved was land. Summit County’s July print shows pendings down and 9.1 months of supply. Two clocks. Price to the one you are actually on.
If you have been touring this August, you already feel the split. A listing inside Park City Limits can go under contract before the weekend. Another, a few miles out in the Summit County, Utah mix, sits. Those are two geographies and two product mixes, not one Park City real estate market.
Start with the board-level news. On August 6, KPCW’s Local News Hour sat down with Park City Board of REALTORS® CEO Jennifer Armandi and Board President Gretchen Hudgens. The August 7 KPCW story put it in print: Q2 2026 (April–June) sales in the greater Park City / Wasatch Back report topped $1.35 billion — 7% higher in dollar volume and 10% higher in transactions than Q2 2025. The breakout was land, not condos.
As of August 28, the Q2 PDF is not on parkcityrealtors.com/quarterly-statistics; that page still leads with Q1 2026. Figures below are according to the Q2 2026 board report as presented by PCBOR leadership on KPCW, and as recapped from PCMLS data by local brokerages.
Figures compiled from Park City Board of REALTORS® / Park City MLS (via KPCW and broker recaps of the Q2 2026 report) and from the Utah Association of Realtors® Local Market Update for Summit County (ShowingTime; current as of August 10, 2026). Data is deemed reliable but not guaranteed and is subject to revision as late-reported sales post. Not all Park City–area listings are on a single MLS feed.
Two clocks, same August
If you are listing or shopping inside Park City city limits, Q2 2026 was a different tape than the county-wide July print.
| Park City Limits, Q2 2026 (Apr–Jun) | Summit County, July 2026 | |
|---|---|---|
| Median sale price | $3.8 million | $1.9 million |
| Days on market | 4 (median DOM) | 55 (until sale) |
| Closed sales | 29 | 107 |
| For sale / supply | — | 976 homes, 9.1 months |
The city-limits row is from Kathryn Vallee’s Summit Sotheby’s Q2 2026 recap, in a table labeled “Data provided by the Park City Board of Realtors, Q2 2026” — a broker table citing PCBOR, not a PDF on the board site. VUE Christie's Q2 recap of the same PCMLS tape lines up: Park City proper single-family closed 29 sales in Q2 2026 (up from 24), for $148.8 million in volume.
The county row is the official Utah Association of Realtors® Local Market Update for Summit County, Utah, July 2026 (ShowingTime; current as of August 10, 2026) — Summit County, Utah, not city limits, and not Summit County, Colorado. A $3.8 million in-city Q2 median on 29 closings is not the same product as a $1.9 million county-wide July median on 107 closings. Collapse them and you will misprice.
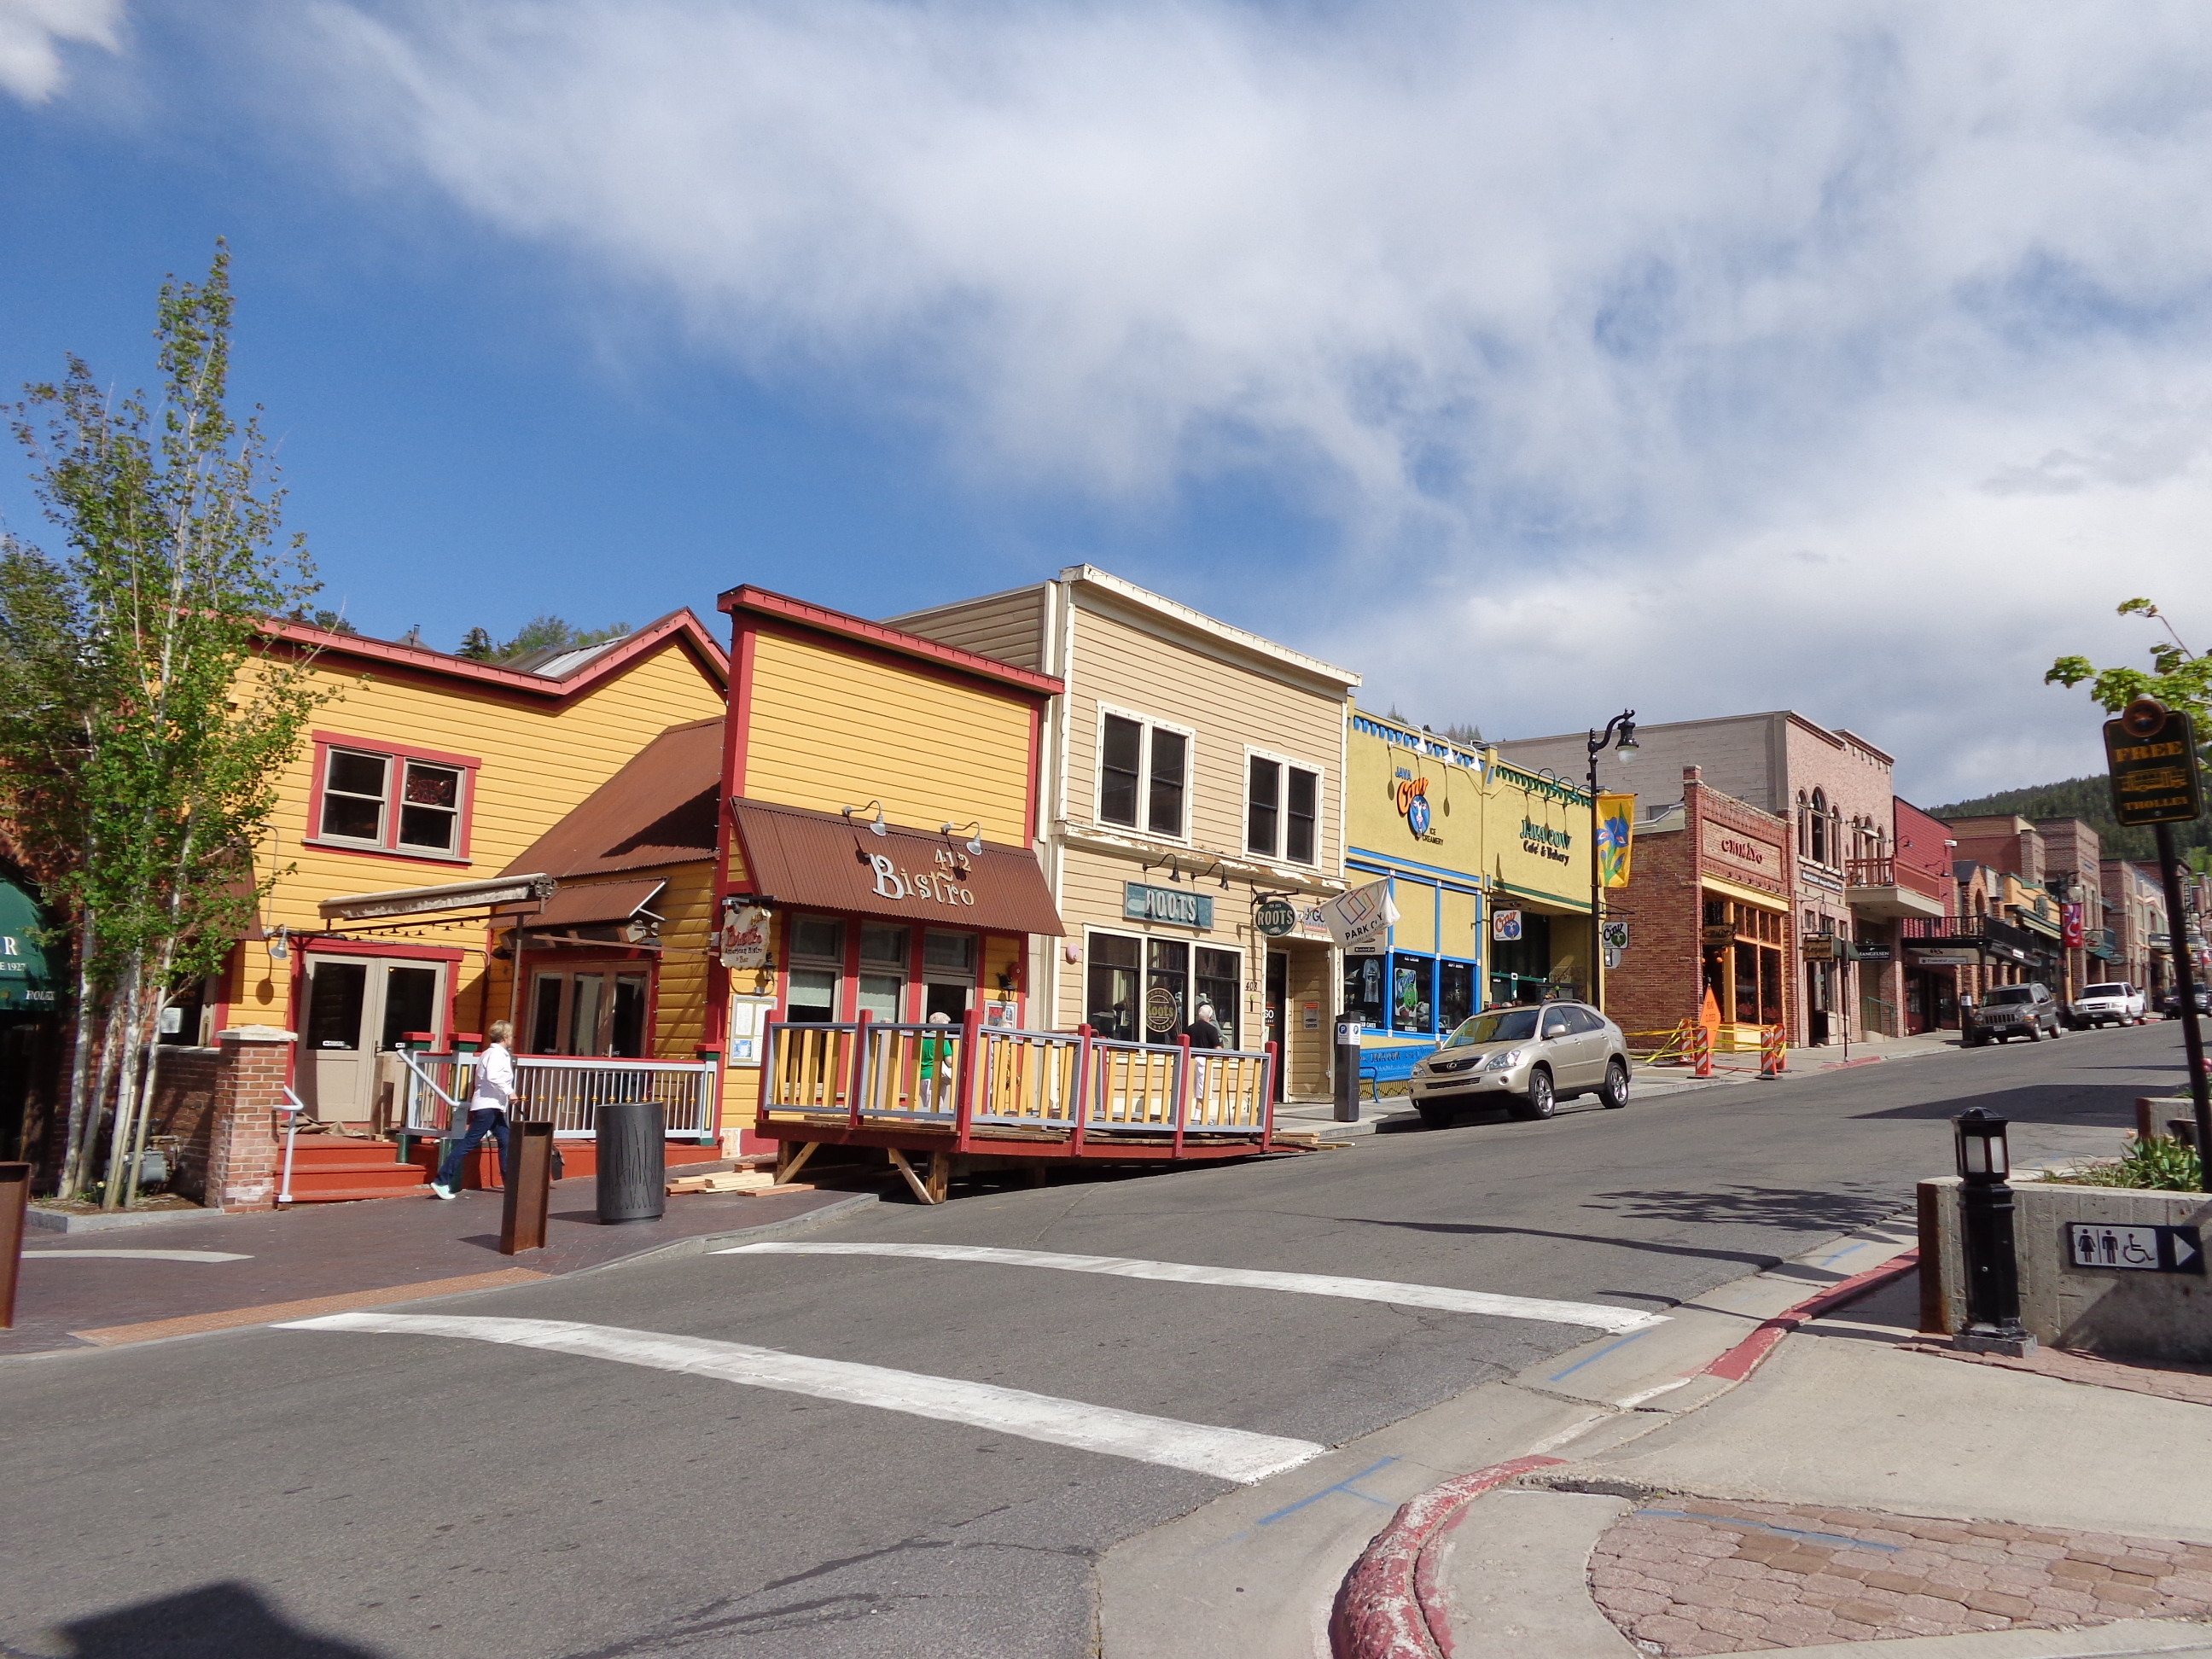
Historic Main Street, Park City, looking toward the ski-town core — the in-city market that still priced at a $3.8 million Q2 2026 median. Photo: Saalebaer, Wikimedia Commons, CC0 1.0.
Land did the Q2 volume work
Hudgens told KPCW that in Q2 2026, land surged while single-family stayed steady and condominiums decreased. Per the August 7 radio news report, Wasatch Back land plot sales rose 46% versus Q2 2025, and land dollar volume reached $180.5 million versus about $89.4 million a year earlier — +74%. Hudgens reads that as luxury buyers choosing to build.
VUE’s recap of the same PCBOR/PCMLS Q2 2026 report puts land volume at $181.3 million (+74%). Same quarter, slightly different rounding: $180.5 million is the KPCW figure; $181.3 million is the brokerage recap.
VUE also recaps combined single-family + condo + land at $1.358 billion for Q2 2026, and trailing-12 local market sales at $5.73 billion for the 12 months ending June 30, 2026 (+9%). Keye Team’s KW Park City recap of Rick Klein / PCMLS uses that same $5.73 billion June 30 endpoint. That is a year of local market sales, not a Q2-only number.
Armandi on air August 6: the market is stable. Inventory is up, which is giving you more choice. Buyers are taking their time, “but they are still moving forward.”
If you are selling Snyderville land, Q2 was your tape (VUE recap: 32 sales / $44.8 million, median $1.475 million). If you are sitting on a condo that competed with 2024–25 new product, you are on a different clock. Same recap: Park City Limits condos, Q2 2026, 47 sales (−11%), median $2.3 million (+24%).
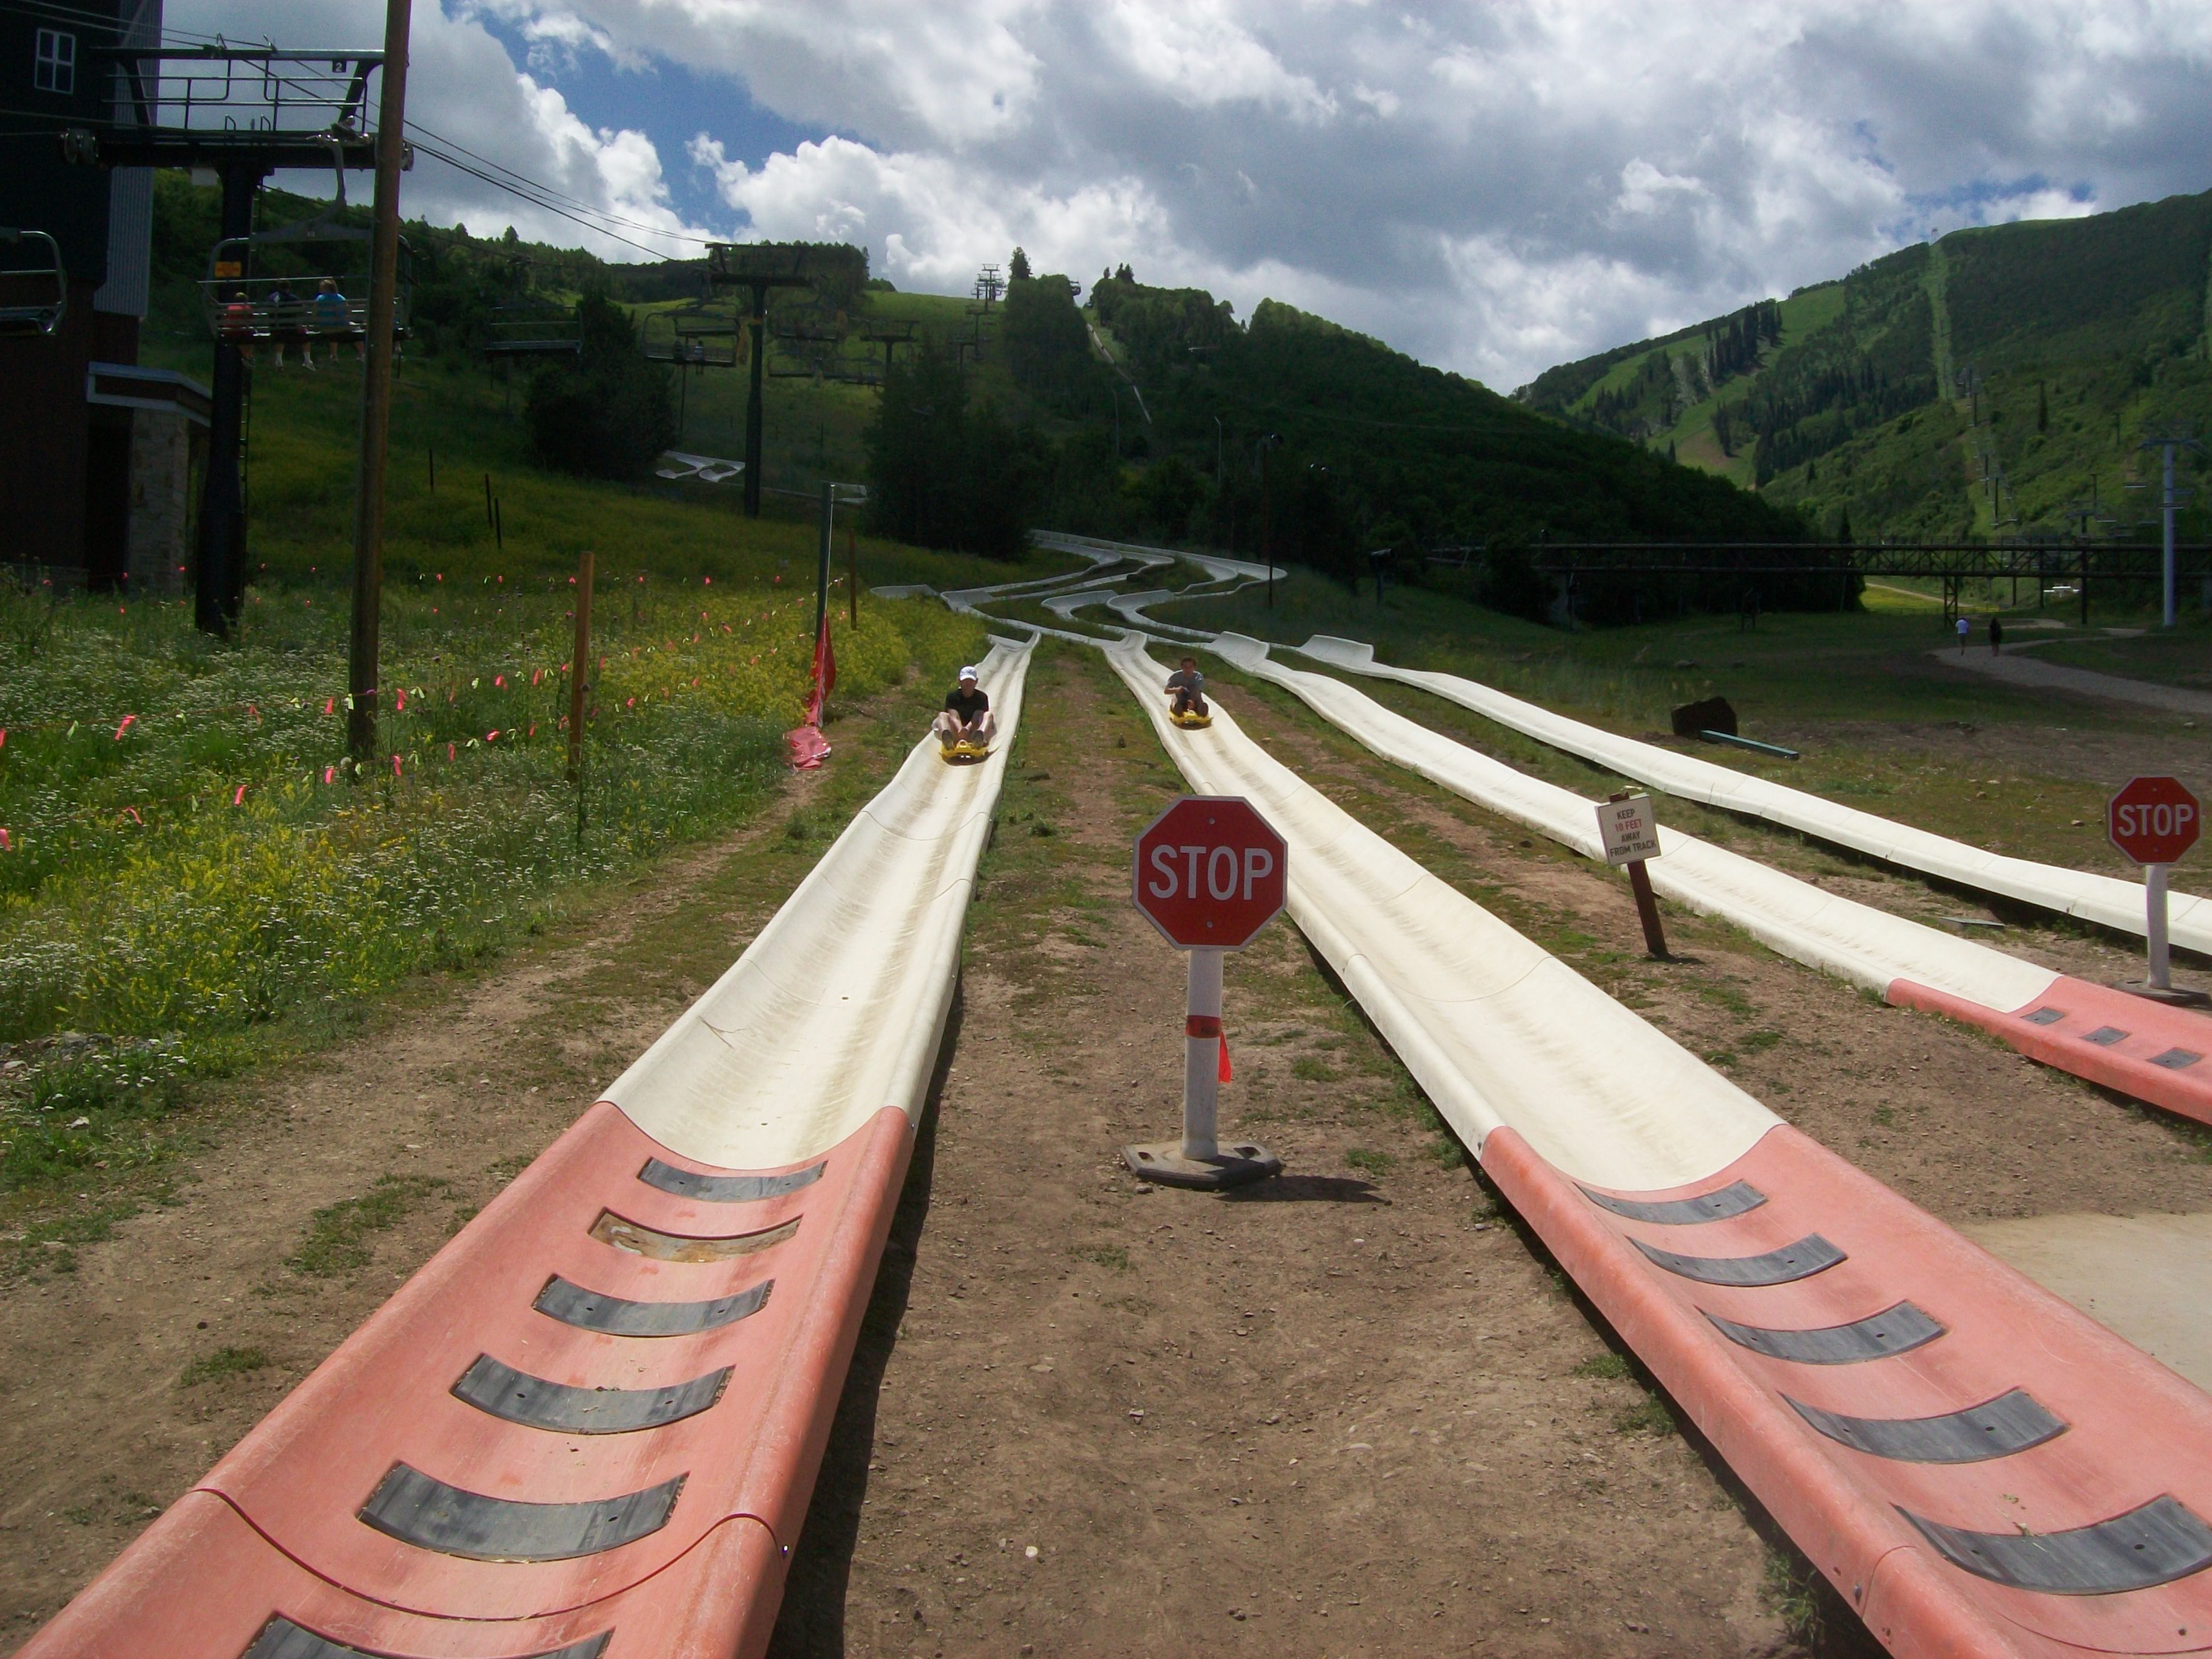
Summer on the Park City hillside — the same landscape that is pulling land buyers into 2026 custom-build sites. Photo: Rockclaw1030, Wikimedia Commons, CC0 1.0.
Summit County in July: pendings hit pause
The newest official monthly is the UAR Local Market Update for Summit County, from the Utah Association of Realtors®, current as of August 10, 2026:
- Pending sales, July 2026, Summit County: 106, down 25.4% from 142 in July 2025
- Closed sales, July 2026, Summit County: 107, down 10.8%
- Median sales price, July 2026, Summit County: $1.9 million (up 26.7% vs. July 2025) — YTD median through July 2026: $1.622 million, down 6.5%
- Days on market until sale, July 2026, Summit County: 55
- Inventory, July 2026, Summit County: 976 homes for sale, 9.1 months of supply
- New listings, July 2026, Summit County: 261 (+4.0%)
UAR warns that one-month activity can look extreme because of small sample size. July’s +26.7% median versus a YTD median still down 6.5% is mix and sample size, not a 27% county-wide reprice in 30 days.
If you are shopping the county-wide tape, you have more to look at. 9.1 months of supply is elevated versus the 2021–22 squeeze. That does not make Park City proper a buyer’s market. Four-day median DOM on 29 city-limits Q2 closings is still a seller’s clock inside the city.
Keye Team’s recap of PCMLS for the 12 months ending June 30, 2026, puts MLS-area absorption at 8.7 months, with inventory the highest since July 2020 (condos +17% year over year; vacant land −38%). Different system, different window: more choice than three years ago, except on dirt.

Deer Valley ski terrain above Park City — the amenity set still supporting the luxury and vacant-land bid in 2026. Photograph by Don Ramey Logan, Wikimedia Commons, CC BY 4.0.
Rates are national. Cash is local.
National context only: Freddie Mac’s 30-year fixed averaged 6.66% as of July 30, 2026, and was still 6.66% for the week ending August 27, 2026. That is not a Park City rate. Hudgens noted on KPCW that higher mortgage rates are influencing decisions; the luxury and cash pool is more insulated.
Nancy Tallman’s Summit Sotheby’s compilation for Park City & Snyderville Basin in July 2026 — a broker compilation, not the UAR county print — put cash at about 60% of activity. If you need a loan, you are pricing rate into the payment. If you are writing cash on a city-limits home or a custom-build lot, you are closer to the Q2 land-and-luxury clock.
Vallee’s Q2 2026 PCBOR-cited table is the other geography check: Jordanelle $3,668,614 (24 closings, 20 DOM); Snyderville Basin $2,250,000 (78 closings, 14 DOM); Heber Valley $940,000 (97 closings, 30 DOM); Kamas Valley $595,000 (22 closings, 16 DOM). Those are Q2 2026 area medians, not July, and not the UAR county print. Price to the row you are actually in.
If you are listing inside city limits, Vallee’s quarter-over-quarter read on that same table was a 5.4% median dip and a 75.8% drop in DOM — a more realistic number getting bid, not distress. If you are buying Summit County-wide, UAR’s July print is the caution: you have room to be deliberate. Armandi’s point still holds. More inventory is more choice.
City and county context: Park City Municipal and Summit County, Utah.

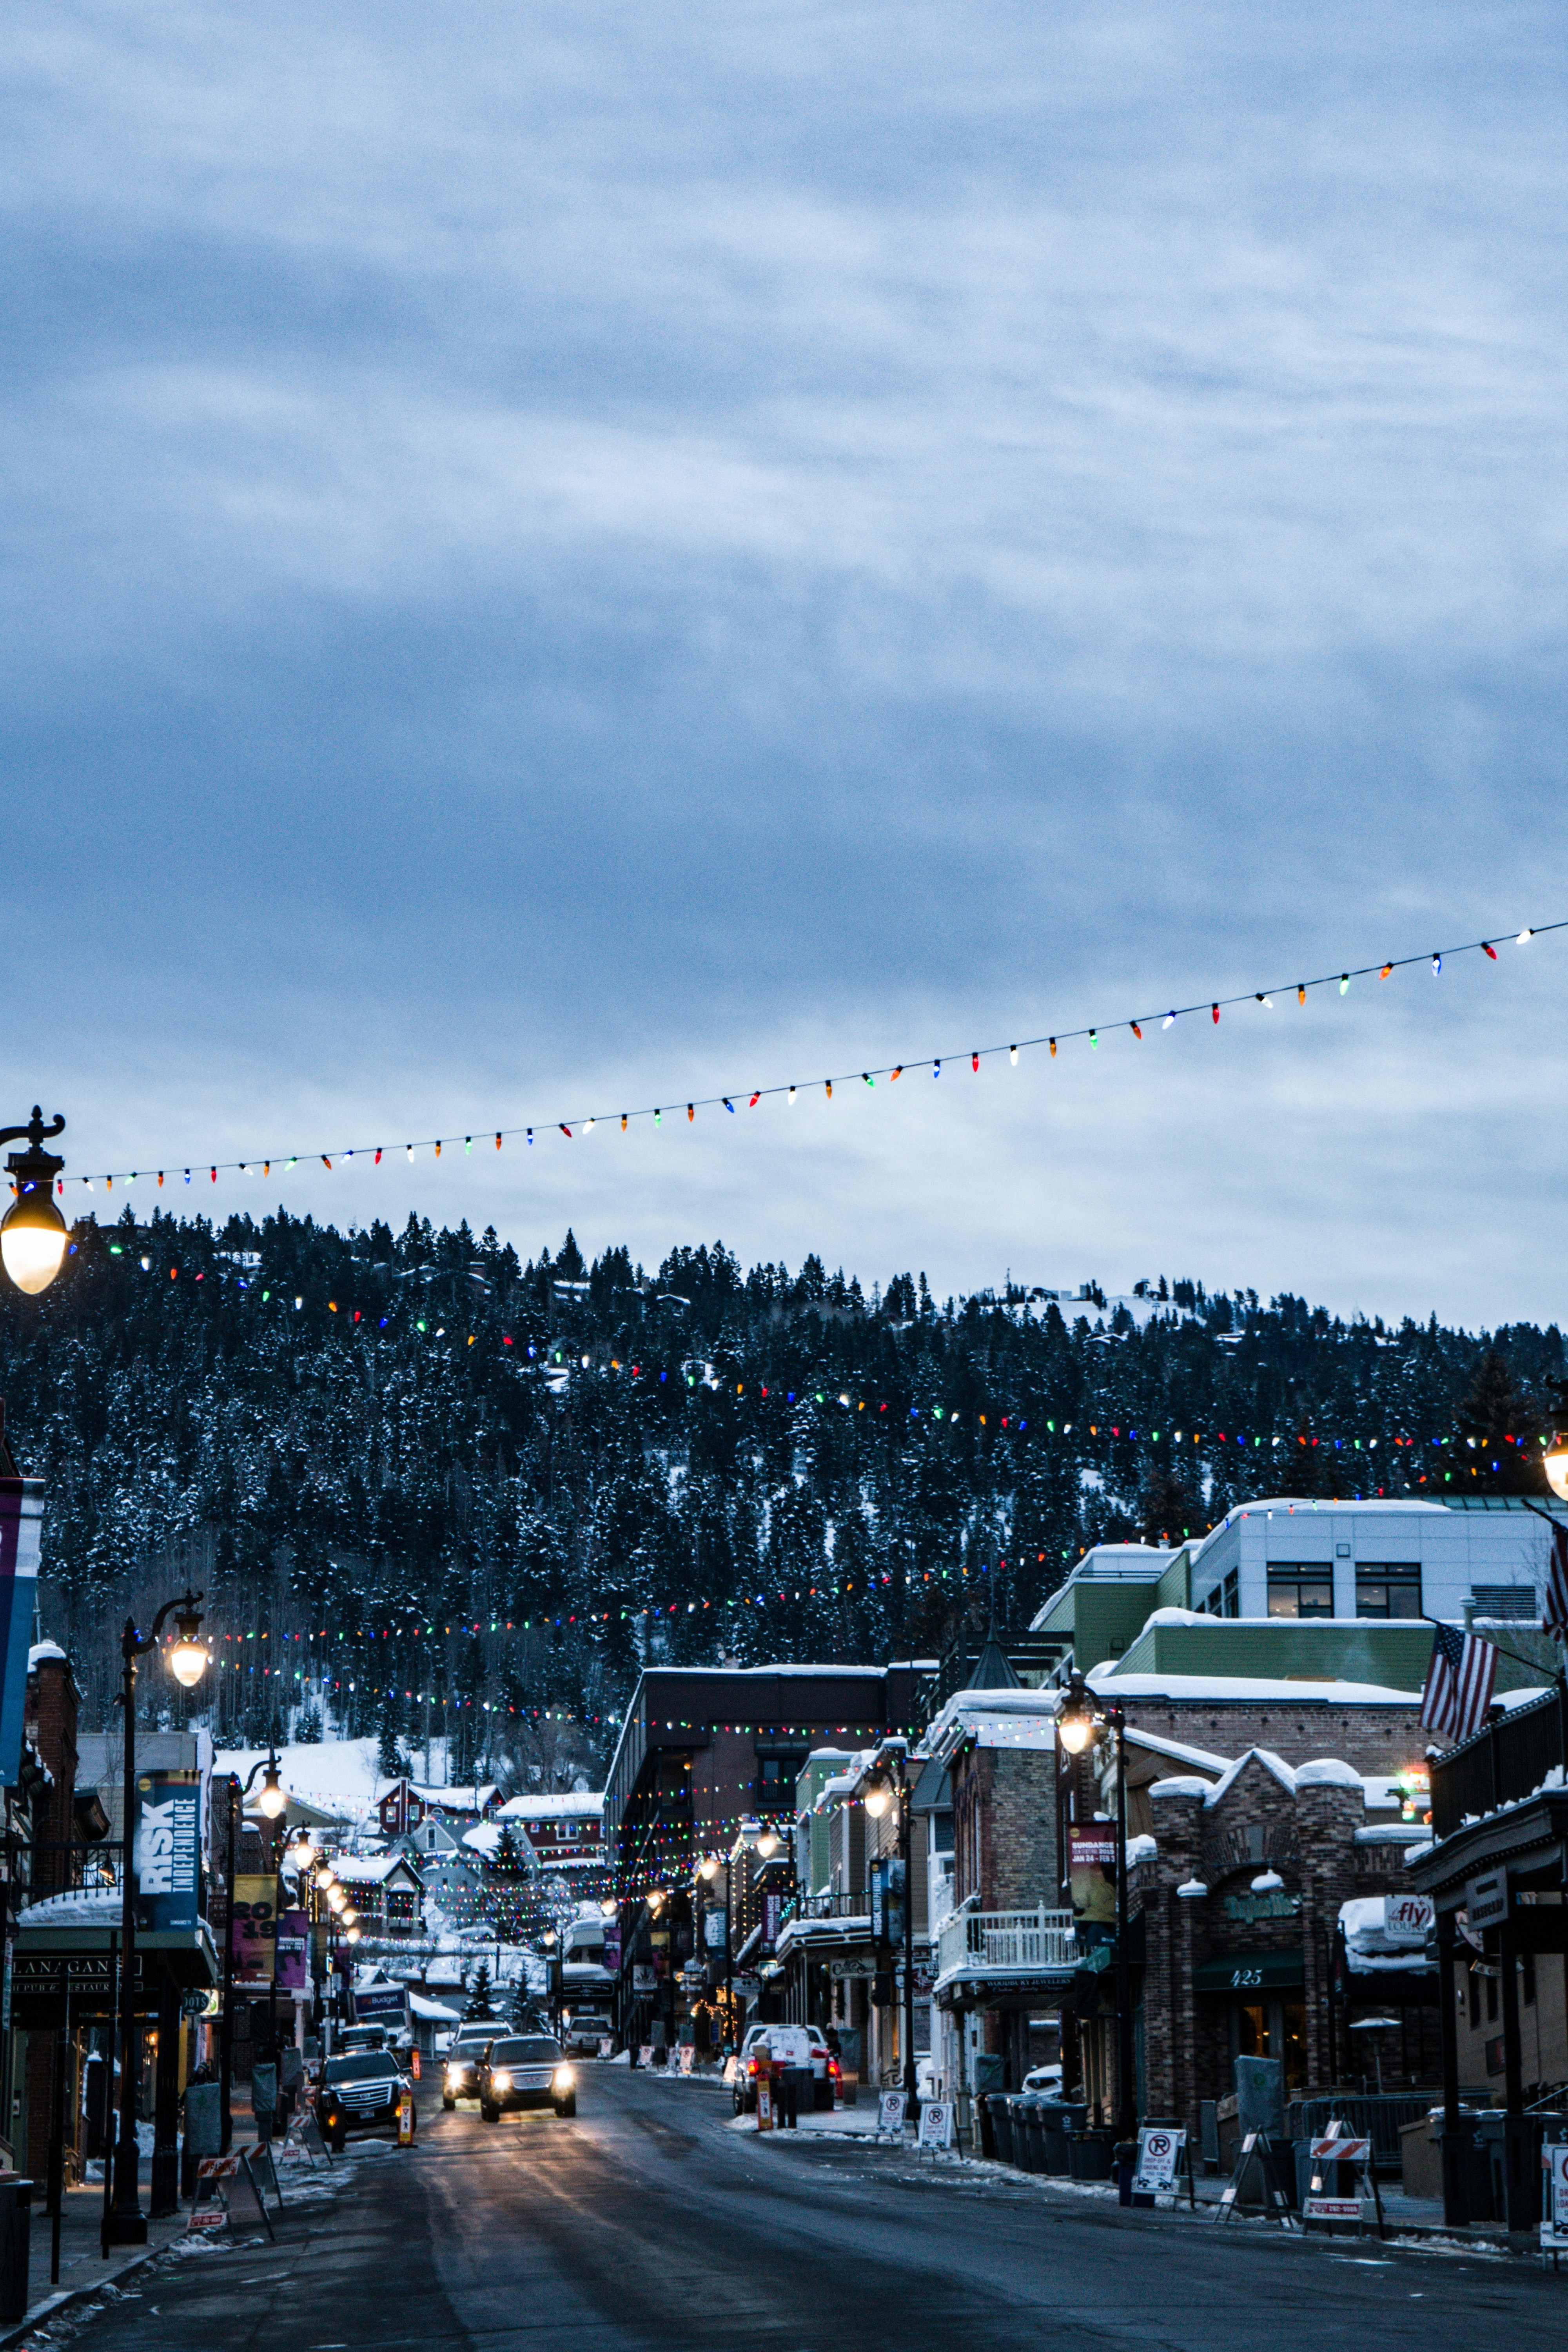
Park City’s Main Street Historic District, May 2021 — Old Town remains one of the fastest-moving slices of the 2026 tape. Photo: Another Believer, Wikimedia Commons, CC BY-SA 4.0.
Resources
- KPCW: Park City real estate data shows stable market, land sales increase (Aug. 7, 2026)
- KPCW Local News Hour: Park City’s 2nd quarter real estate sales top $1.35 billion (Aug. 6, 2026)
- Park City Board of REALTORS® quarterly statistics
- UAR Summit County Local Market Update (July 2026; current as of Aug. 10, 2026)
- Utah Association of Realtors®
- Park City Municipal
- Summit County, Utah
- VUE Christie's Q2 2026 recap (PCBOR/PCMLS)
- Keye Team / KW Park City Q2 2026 recap
- Kathryn Vallee / Summit Sotheby’s Q2 2026 recap
- Nancy Tallman / Summit Sotheby’s July 2026 monthly (broker compilation)
Esteban J. Nunez, Park City Realtor.
Categories
Recent Posts


,_Apr_16.jpg)